ASK THE EXPERT
Ernesto Toxqui Damian has been with PMA 5 years and is a certified eBuilder Partner with a software engineering background. He is a proven software developer, business analyst, and project manager with hands-on experience with Java, Javascript, SQL, VBA, and Business Intelligence tools.
We sat down with Ernesto to discuss Power BI and data dashboards for a wide variety of projects. Here he provides an overview of Power BI and the prerequisites to its most effective use and realization of its potential to provide detail to the owner and value to the project.
How is Power BI used in project management?
![]() Power BI is a Microsoft product. Specifically, BI stands for Business Intelligence. It allows, first of all, to report on critical aspects of the project. When you’re working on a project, you as a project manager need to know the health of your project: the status, is it progressing, is it doing well in critical areas of project management, like cost and schedule? Power BI allows you to create outputs that show project progress and eventually compare and correct any mistakes if something is not going according to plan.
Power BI is a Microsoft product. Specifically, BI stands for Business Intelligence. It allows, first of all, to report on critical aspects of the project. When you’re working on a project, you as a project manager need to know the health of your project: the status, is it progressing, is it doing well in critical areas of project management, like cost and schedule? Power BI allows you to create outputs that show project progress and eventually compare and correct any mistakes if something is not going according to plan.
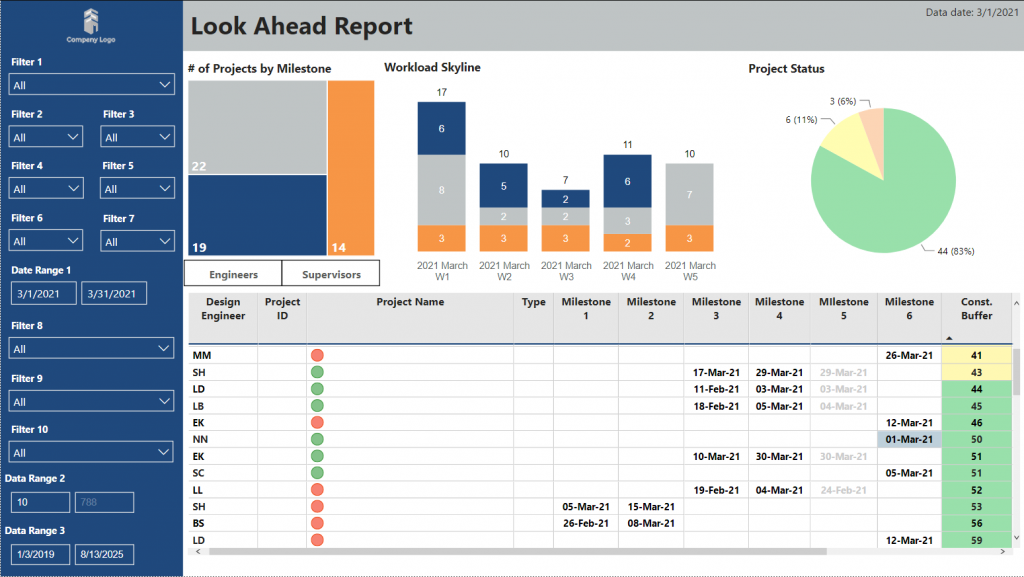
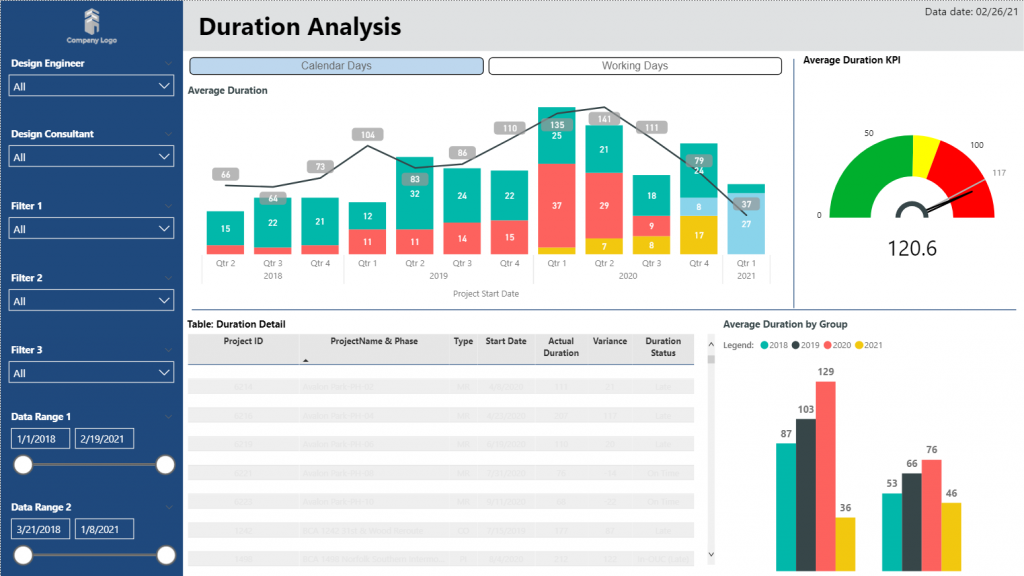
 In a nutshell, Power BI allows your report to provide outputs and allows you to interact with your reports and play with the data. Let’s say, for example, that you see a schedule, and all of a sudden, you see it is falling behind. With a click of a button, you can see which activity you are behind, who is responsible, and which metrics and specific phase in the project are impacted. It allows you to roll up information but also allows you to go into detail.
How is Power BI different from other tools to show the progress of a project?
First, it’s a Microsoft product that means that if your company’s already working with the typical tools like Excel, Word, Access, and PowerPoint, it is likely to have access to Power BI. That’s a huge advantage because that means that the company doesn’t have to pay for additional licenses for innovative tools. And also, that is relatively easy to implement.
Were you surprised about the versatility of business intelligence dashboards and how they impact project management?
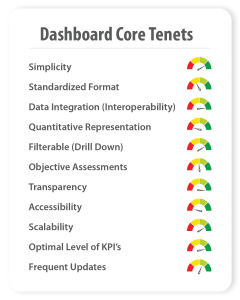
Yes, the project managers, board of directors, top program managers love it. Why? Because it’s high level and provides different colors for visual impact, which is essential because the information is live. It holds content and meaning for the stakeholders.
When you re-develop a project report, a narrative is just text. In some cases, it doesn’t tell the story, or sometimes it does. But when you add specific graphs and charts, and, on top of that, when you click on something, you can now read information, you can slice and dice it, group it, and roll it up. You can detail project management in different areas like the cost and the schedule, combining information from multiple sources. You are not limited only to, let’s say, Excel.
That is a typical data exchange. A spreadsheet is a typical data exchange format, but you can have comma-separated values. You can have a Microsoft Access database and access SharePoint. You can access Oracle databases to Microsoft SQL Server databases. And, in central systems like Primavera P6, for example, that core database is one of these tools.
Power BI is flexible enough to connect us to those databases and collects information from not just one source. So, you can mix all this information and have XML and CVS. You can have adjacent information and put together an excellent report or a dashboard containing multiple reports. Basically, it’s one dashboard, but it can contain multiple tabs, each having a specific area in project management.
How do I create a project management dashboard in Power BI?
I think this requires multiple skills. You need to know about project management to create a project management dashboard. The first thing is to know about the industry is to know about the area, and in this case of project management, to learn about Power BI in general. Then be specific with your client about what to construct with the principal areas of project management: cost, schedule, risk, change management, resource management, capacity, procurement integration, scope, quality, and so on.
The first thing is to define what these areas are and if all these areas will be integrated into depth in this dashboard. The next thing is to understand what the data sources are. For example, in our industry, the schedule usually comes from Primavera P6, but we are not limited. It could be Microsoft Project or any other tool.
In the case of cost, where is that data coming from? It could be SAP, Oracle Unifier, an Excel spreadsheet, or an Access database. We need to identify the data sources of the information. We also need to understand the client’s specific business rules.
Let’s say the tool is Oracle Primavera P6. How am I using it? How is my WBS? How is my EPS? How am I organizing the projects? How am I managing the baselines? Understanding those specific business rules is very important because they may define how to access the information and what rules to apply in my queries.
The following requirement after understanding the data is getting the data into Power BI. When I get the data, I make that correlation to the data source. I write a query or queries when I need to grab the information in a specific format with the specific fields. And the next step eventually is the creation of the task.
Using the visualizations–namely graphs, charts, and the content to display in the dashboards–we feed them with the data received from the queries and create interactions with all those queries and data analysis by having the right relationships. In a nutshell, these would be the main steps to develop a dashboard.
After finishing this part, we need to publish it. Publishing means transferring information from the Power BI desktop into the Power BI web. Power BI web allows us to manage the information, including who has access and publish it in a specific location.
What applications have you used to live stream data?
We are using all kinds of reports in Power BI now. So far, it’s been great because there is a big market in multiple areas. PMA, as a company, has an in-demand niche that we are exploring. This niche provides work, represents that we are billable, shows that we have activities to perform. Also, a client more than likely already has Power BI at no additional cost, and they just have to use it. You just have to leverage what they already have.
One of our principal themes at PMA and especially at our Long Beach office is that we are “tool agnostic.” We can adapt to any company and client needs. We have worked with Microsoft SQL server, as in our SQL server reporting services; Oracle BI Publisher; and Oracle analytics.
Have you ever used NetPoint as the scheduling tool to bring data into Power BI?
Yes. Remember that Power BI is not limited to one specific software or application. In the case of NetPoint, it’s our trademark system for project management software. That connection is possible because, again, we can exchange information in multiple formats. In my case, I’ve worked specifically with NetRisk, one part of the NetSuite. And we have created some dashboards specifically for the area of risk.
What business intelligence dashboard skills should project managers look for?
I think that different skills are needed, depending on what role we’re playing. One skill is to know how to develop a passport. Another is to have the business knowledge of the industry or the client. Another is to know the technical knowledge of the system from which we are accessing information and then identify the end-user, including but not limited to project managers, for example.
The end-users could be project managers, program managers, directors, board of directors, people with high positions in the company, and primary users. In the case of Power BI, dashboards can be created for these users.
Usually, when we sell the applications, the passports are targeted toward the end-user at a high level. However, they can also be used for people who are hands-on in the project. For example, they can be a QA- quality assurance check just to make sure that:
- The data that I input is correct.
- The project ID or number that I input is correct.
- There is a connection between the cost and the schedule.
- Did I leave out one activity that carries a cost, but it was not on the other side? It’s in cost, but it’s not as scheduled by the person.
These types of quality assurance checks are essential to know and require a specific role. Usually targeted at that role, but they may be easier for the scheduler or cost engineer.
Other types of reports in the dashboards are primarily targeted at the end-user. Maybe it’s a program director interested in checking their portfolio. When they are checking their portfolio, they are interested only at the high level.
This means that I’m interested only in summarizing the projects, not in the project in detail. However, if something catches my eye, I click a button and see the detail in such a case. How is that a specific project? Why is it giving me trouble? Why is it not having the performance that I expect? However, in general, the report is just expected to review the information at a very high level. We target the dashboards depending on the role and the position.
To develop a task force, I mentioned that one person is a developer. The one who creates the data visualizations also makes the connections between different data sources. That person needs to be technical but mainly needs to understand the business rules.
What do I mean by business rules? For example, if I’m thinking about the cost, knowing in what system and format to find a cost. If I have a project ID, what is the project ID that these specific companies are using? A few examples:
- Is it using digits?
- How many digits is it using a combination of letters-dash numbers?
- Is it using baselines or a baseline schedule?
- How are they using the baselines?
Do they have a person who is the database expert? That is who knows how to connect to those systems and grab and fetch information from those systems. For example, a person who knows SQL, a person who knows the format of XML, one who knows the format of CSV and can grab the information: how to write SQL statements, write CSVs separated commas, the characteristics of the adjacent format, how the XML is, etc.
There could also be their hybrid roles. Very highly skilled people can have multiple hats, different roles and can also do one activity. It’s not limited to the person who has access to the system; another person could be the one who knows the business rules. Or it could be that the same person. However, developing a dashboard and using the dashboard data as a consumer are different functions as a rule.

